Following some projects i did in the past:
-
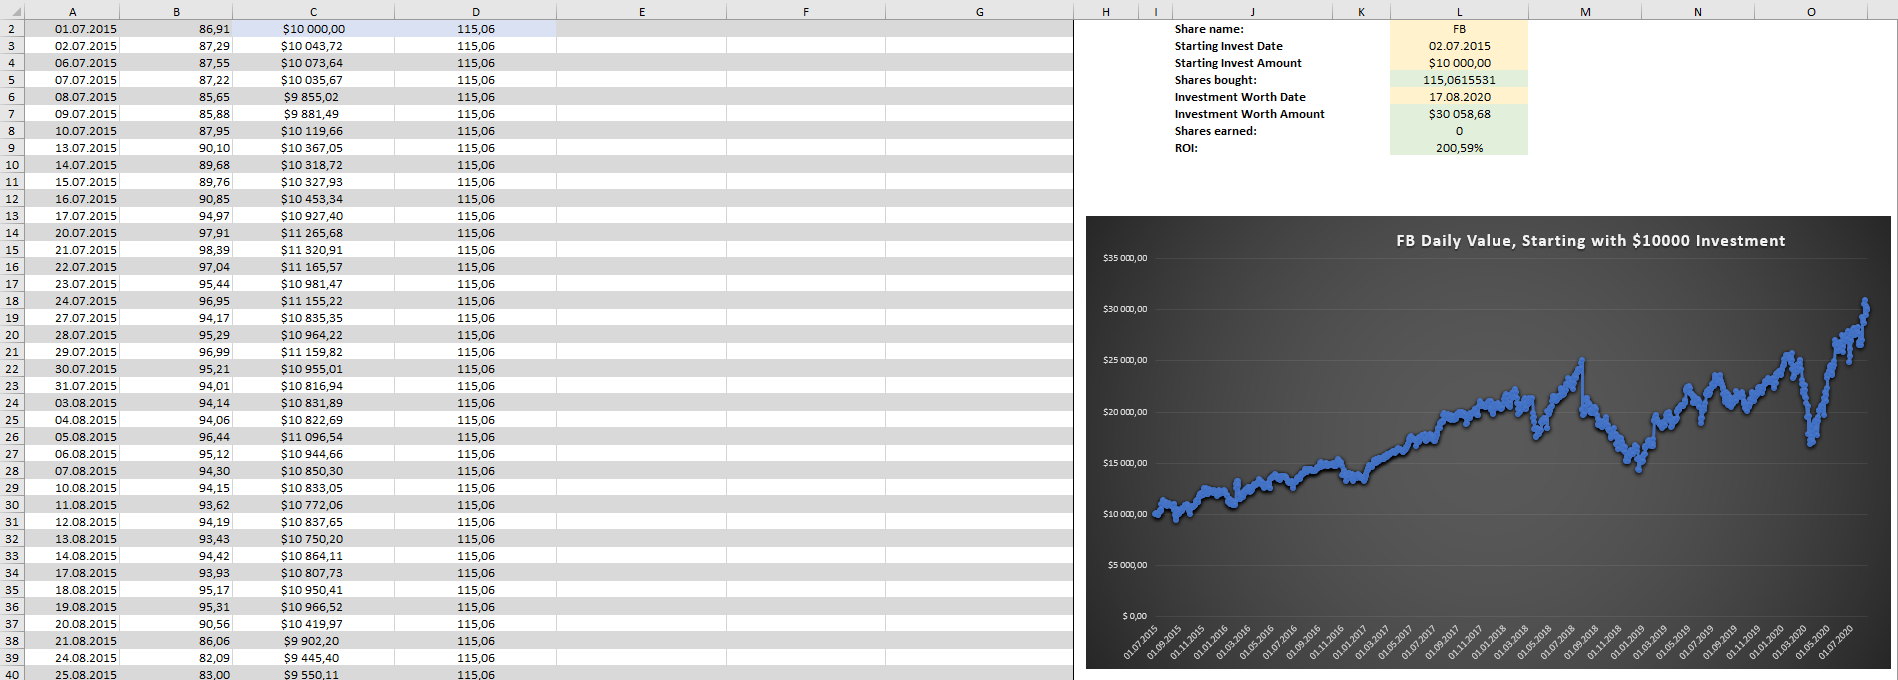
Create a overview for buying a stock and get the daily value and shares.
Input the stock ticker, starting invest ammount, start- and end-date of
the investement and do the calculation. Show the values-changes in a chart
and create new measures like 5Year Average Dividend Yield, Dividend Yield
Increase, Price to Total Assets, EPS to Dividends and many more
-
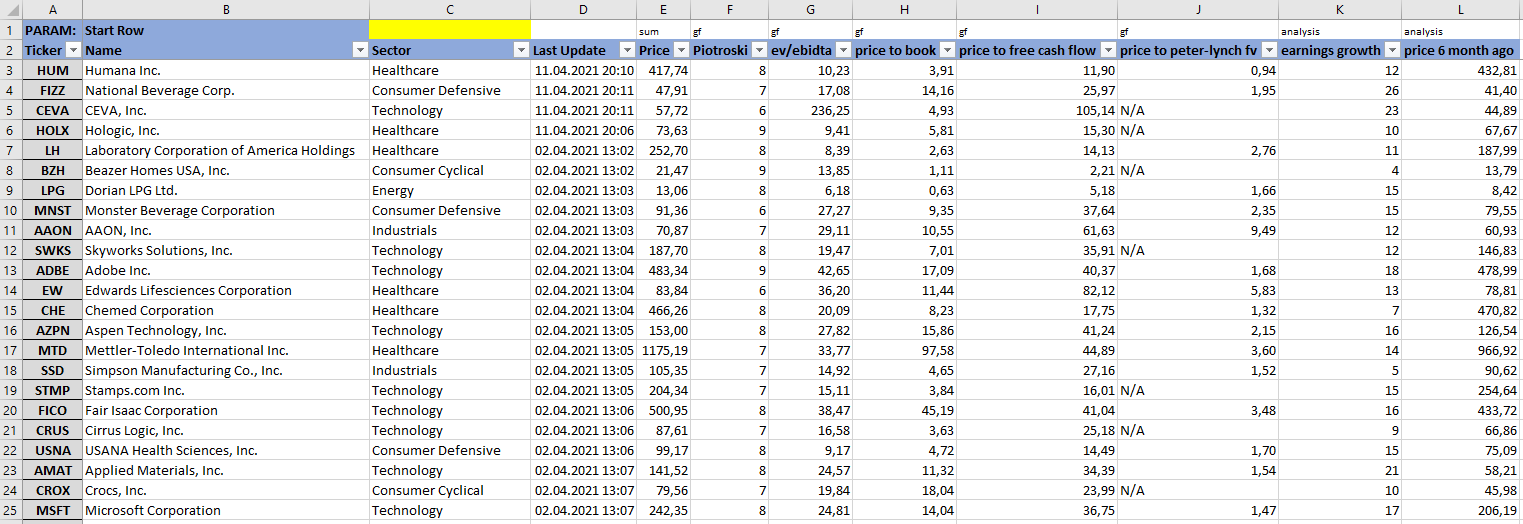
Report for all invested stocks on an hourly basis. Input the stock tickers
in the first column and get the information in the other rows and columns.
Flexibility when running the live-data with a parameter setting for the
starting row. The following information is scraped and displayed: Name, Sector,
Price, Piotroski Score, EV/Ebidta, Price To Book, Price To FCF, Price to
Peter Lynch Value, Earnings Growth, Price 6 Months Ago.
-
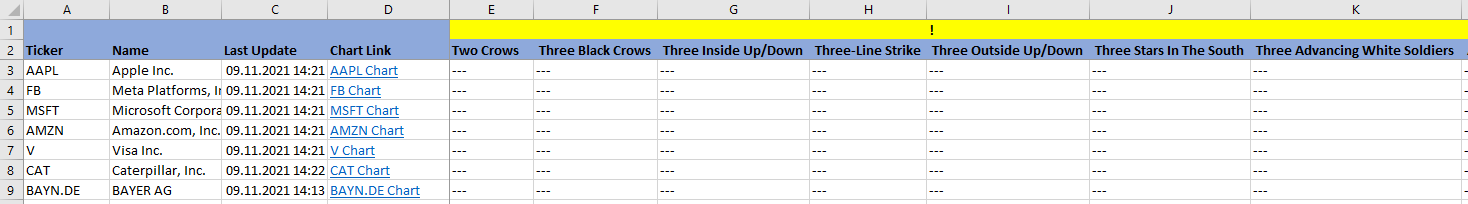
With this program you keep track of your stocks and keep informed of every
trend change. You can choose from over 80 trend signals - which are
automatically checked at any time! With this program you keep track of your
stocks and keep informed of every trend change. You can choose from over 80
trend signals - which are automatically checked at any time!
-
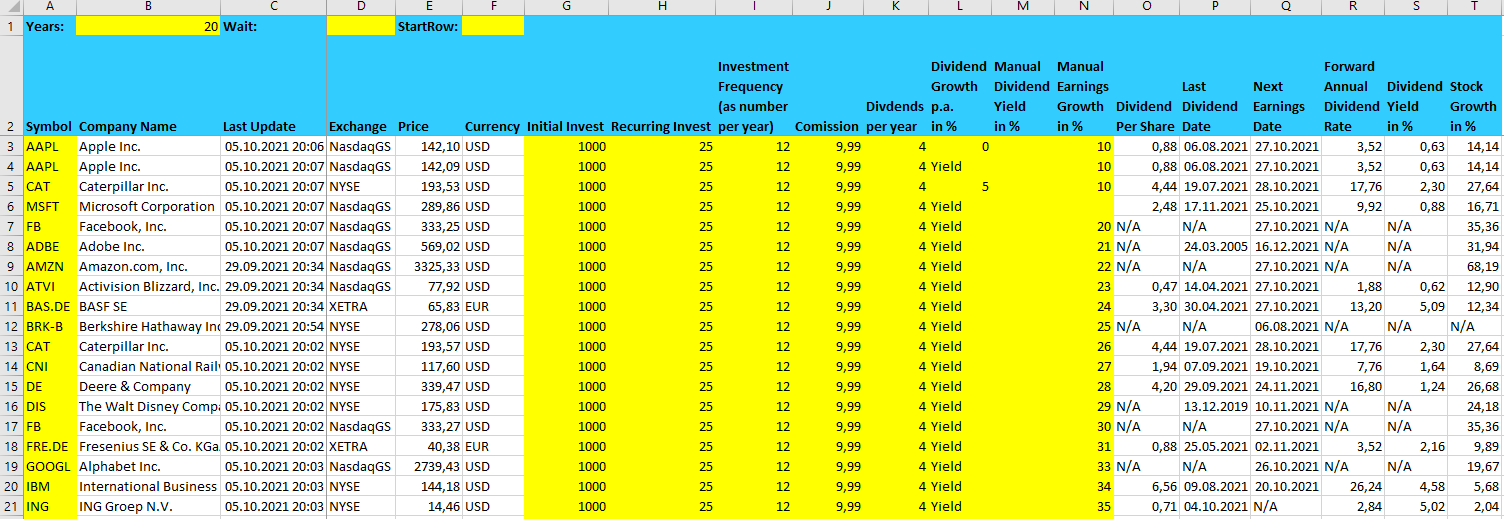
Calculate the future value of your stocks for up to 40 years. Many parameters
can be used for the calculation – individual for every stock (initial investment,
recurring investment, investment frequency, commission for stock buys,
dividends per year, optional manual dividend growth, optional manual earnings growth, etc.)
-
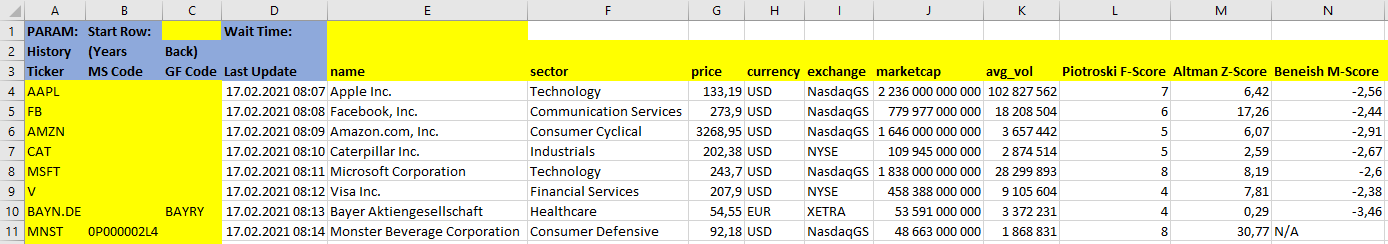
With this program you keep track of all stocks. Choose from thousands of
stocks and over 500 displayable information and key figures. Choose from over
than 500 metrics and information fields. Over 200 key measures are calculated
and available E.g. Piotroski Score, Graham Number, Peter Lynch Fair Value, Yacktman
Behalten Sie den Finanzüberblick
Als zertifizierter Fiverr Professional erstelle ich Ihre individuellen Finanz-Übersichten mit Python-Programmen. Die Live-Daten werden von verschiedenen Plattformen wie zum Beispiel Yahoo Finance, GuruFocus, CoinMarketCap oder Aktienbörsen bezogen und als parametrisierbarer Report oder Dashbaord zur Verfügung gestellt. Die Daten Ihrer Aktientitel und Kryptowährungen werden jede Stunde oder jeden Tage abhängig von Ihren Anforderungen aktualsiiert. Das Reporting kann in unterschiedlichen Formaten als Excel, Google Sheet, Word, PDF oder HTML erfolgen.
Finanzielle Übersicht auf Knopfdruck!
Schauen Sie sich an was mein Kunden dazu sagen - Feedback
-
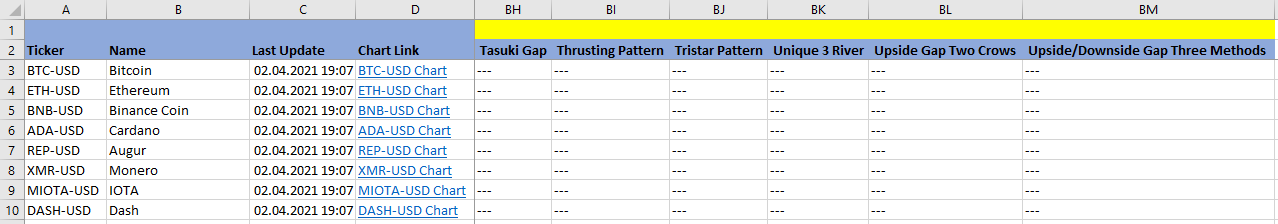
With this program you keep track of your CryptoCoins and keep informed of
every trend change. You can choose from over 70 trend signals - which are
automatically checked at any time! Check over 60 trend patterns like Doji,
High Wave Candle, Hikkake, Hanging Man, Spinning Top, …) for daily and intraday
periods.
-
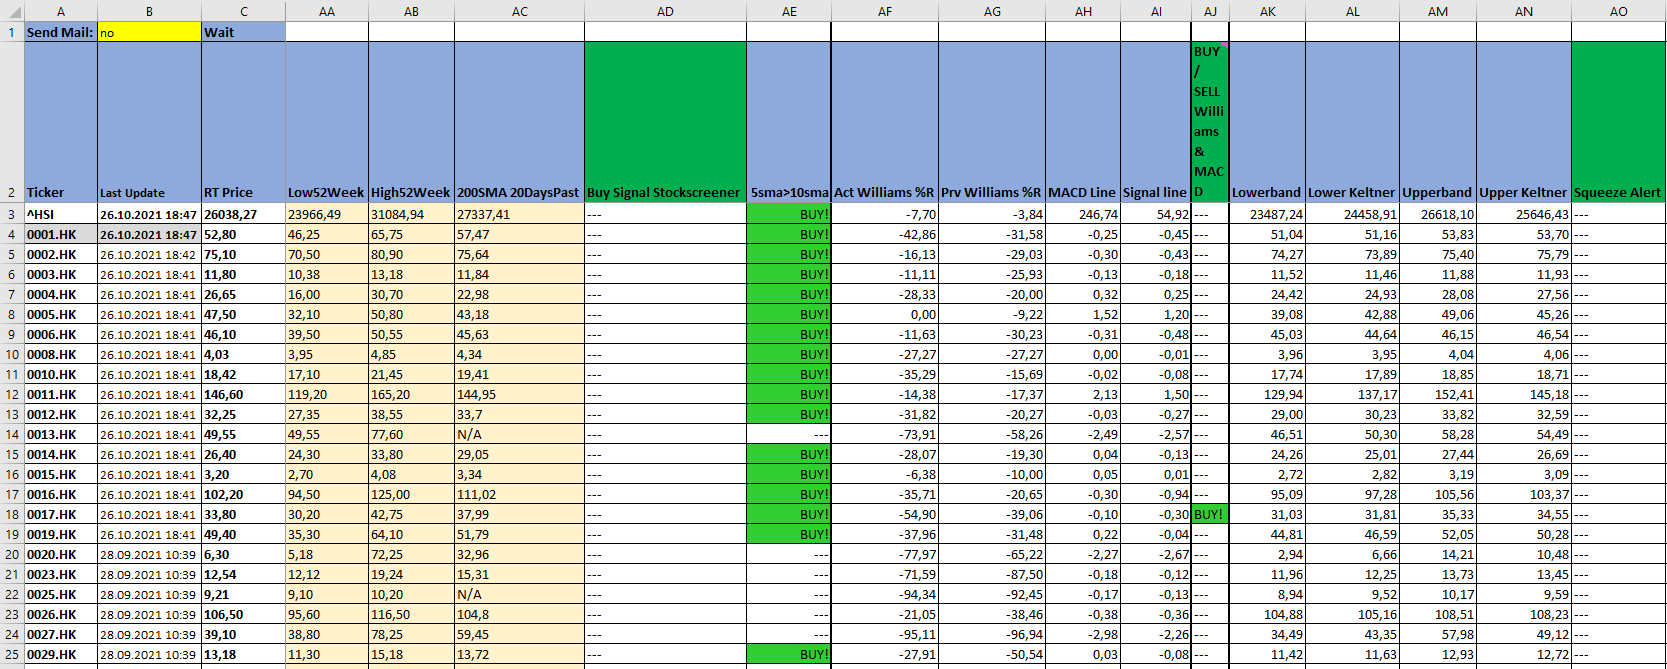
Created a trigger solution where you can input the tickers you want to check
in the column A and get several measures calculated. Checking for Buy / Sell
Signals regarding 5SMA > 10SMA, Williams & MACD, Squeeze Alert. Every Alert
get highlighted in the report and also a email with the information is sent to
the customer. Additonal informations which are shown are: Low52Week, High52Week,
200SMA 20Days Past, Lower Band, Lower Keltner, Upperband, Upper Keltner and
many more
-
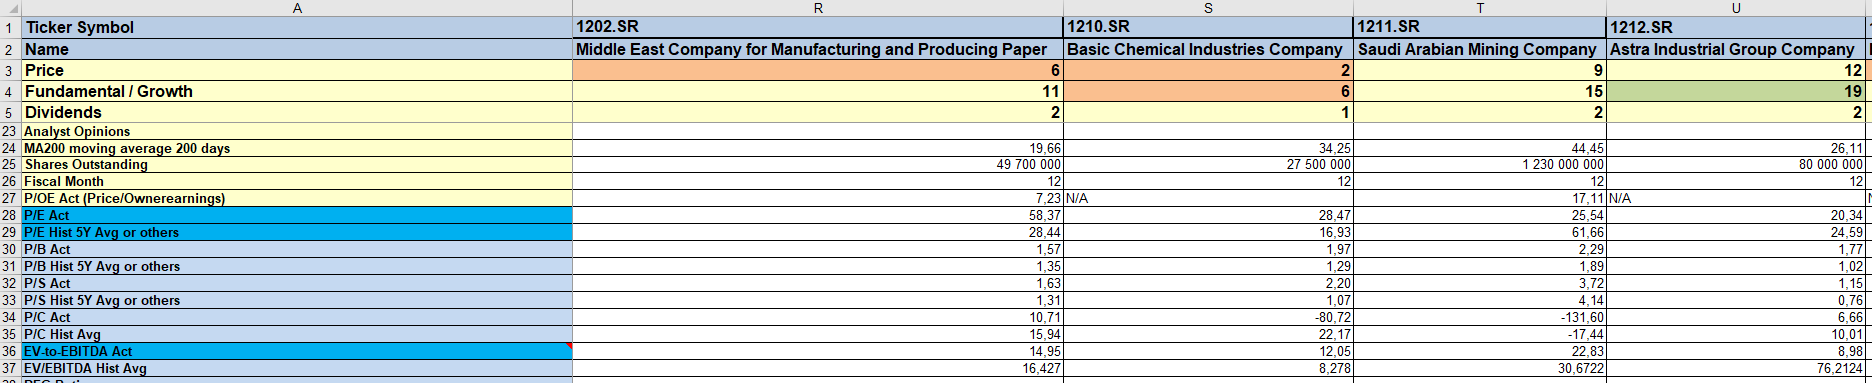
Evaluation of the TASI stock exchange. Calculating different valuation for price,
fundamental, growth and dividends. Checking different Actual and Hitory values
like Price To Book, Price To Sales, EV To Ebidtta, Price To Graham Number,
Free Cash Flow, Debt Equity, Pric To Earnings and many more. Put all the
stocks you want to evaluate in the row 1 and run the program.
-
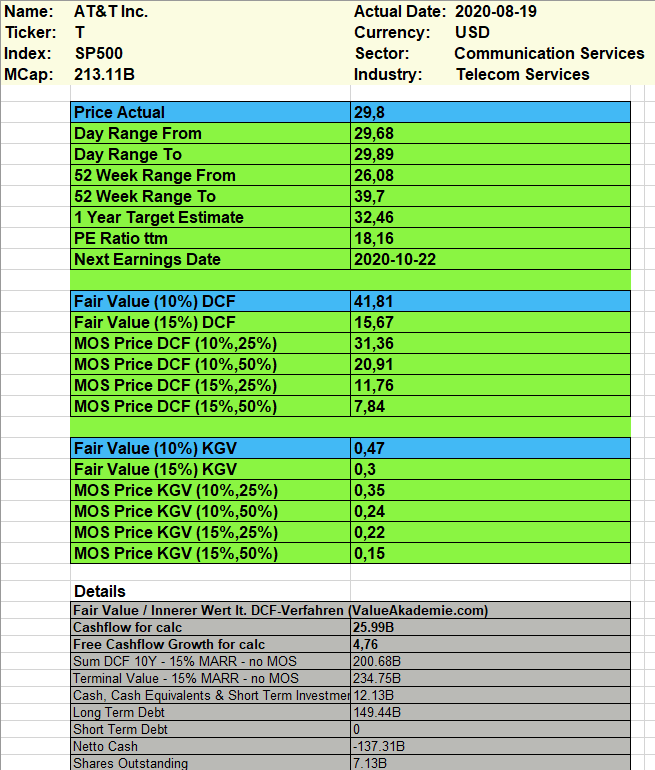
Make a fair value calculation in seconds with just a click! Fair value calculation
was never easier! This program enables you to do a automatic Fair-Value calculation
according the DCF- and PE-Method within less than 2 minutes for over 5000 stock titles